Live data from the Morland Rain Gauge
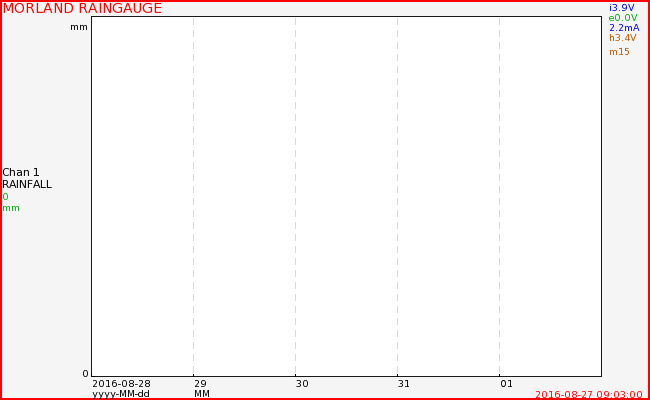
These graphs show the rainfall from the rain gauge at the Morland Catchment, Cumbria.
Last five days

Note: this rain gauge was installed on the 23 September 2011.
Note: The data showed here is live, raw, data from the field instruments and hence has not been subjected to quality control. Therefore, the data is presented for visualisation purposes only and does not represent a quality assured product of any of the consortium partners. Quality checked and assured data will be available from this site in the future, once the IT systems for this have been developed.
Category: Rainfall


Hello, can you tell me more about the technical aspects behind this: how are the data transferred to this web site? I’m interested because we want to help a micro-insurance project in India with similar features. Thank you in advance,
Nico Heijnen
Achmea
The data is transferred from the datalogger via a mobile phone data link (GPRS) to a website run by isodaq in the UK. Their web site currently generates the graph which is displayed here. We are also using a firm called Meteor Communications for the water quality data and associated graphs.
Thank you