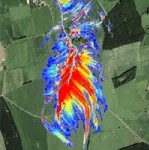
SCIMAP diffuse pollution risk mapping and EdenDTC

The SCIMAP diffuse pollution risk mapping framework is being used within the EdenDTC project to identify potential critical source areas within each of the focus catchment.
SCIMAP works by calculating the spatial pattern of relative potential erosion and hydrological connectivity and combining these maps to give possible locations of diffuse pollution risk. This diffuse pollution risk is then routed through the landscape and diluted according to the amount of water that would flow through the point. Therefore, SCIMAP produces maps of where in the landscape the diffuse pollution risk is accumulating faster than the dilution potential, which can lead to observable in-stream water quality problems.
Although the SCIMAP approach gives detailed predictions of the spatial pattern of risk at the sub-metre scale, it does not have complete knowledge of the environment. Therefore, the predictions should be treated as ‘where to look first’ for the locations for possible mitigation measures within the landscape. Subtle features may not be represented in the spatial data and hence ground based investigations are still required. The other important point to note is that SCIMAP predicts the spatial pattern of relative risk – areas labelled as high risk within a catchment are the highest within that catchment and may not be causing a problem. The SCIMAP predictions must be interpreted in the context of the local water quality status. However, the approach provides a systematic and consistent method to identify where in the catchment a mitigation measure would have the most impact through the manipulation of either source risk or the connection to the river.
Further details at www.scimap.org.uk
Below is a sample set of output for the Newby focus catchment in KML format (compatible with GoogleEarth):
- mor_landerosTrans – Newby potential pattern of surface erosion. Red is the highest relative risk, blue is the lowest
- mor_connect – Newby potential hydrological connectivity. Blue represents the highest potential connectivity and red the lowest.
- NewbySCIMAP-inchannel-risk-concn – Newby in-stream relative risk. Red and yellow represent higher risk and blue represents lower risk.