
Mary Ockenden, Lancaster University, Nick Barber, Newcastle University and Phil Haygarth, Lancaster University and members of the Eden DTC team
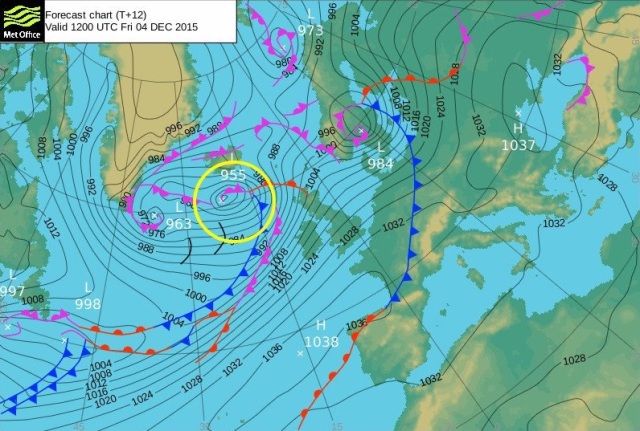
12 January 2016. pdf: Storm Desmond and Eden DTC3
Summary points:
- The storm did not hit the Eden DTC catchments equally (rainfall – 156 mm at Newby Beck; 174 mm at Thackthwaite Beck; 55 mm at Pow Beck, which fell continuously for 34-37 hours)
- Maximum discharge (accepting the uncertainty of rating curve when exceeded) was highest ever recorded by DTC at Thackthwaite Beck, nearly equal highest at Newby Beck and below the highest at Pow Beck
- At all sites the duration of the storm was remarkable: e.g. at Newby Beck, discharge > 6 m3s-1 for 31 hours (c.f. maximum discharge on 22 Nov 2012 was higher, but > 6 m3s-1 for only 3.5 hours)
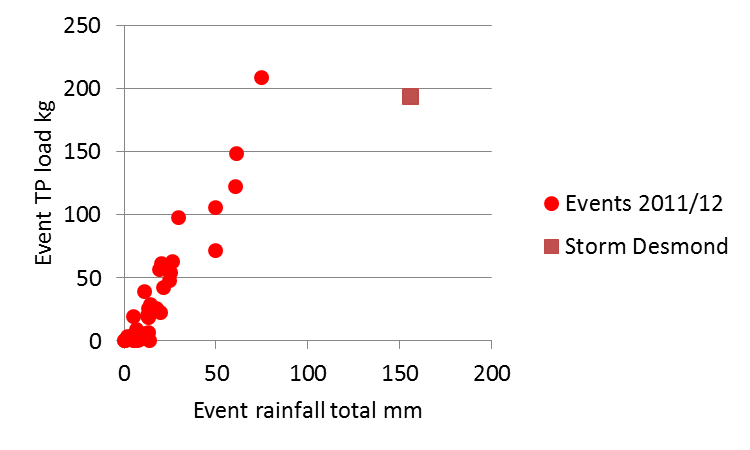
- Sediment/Nutrient data is only available from Newby Beck. Event loads transferred during Storm Desmond were: sediment (84 tonnes); total phosphorus (TP) (194 kg); total reactive phosphorus (TRP) (78 kg); nitrate (8.9 tonnes). For sediment this was 12 – 22% of previously recorded annual loads; for nutrients 8 – 13% of annual load
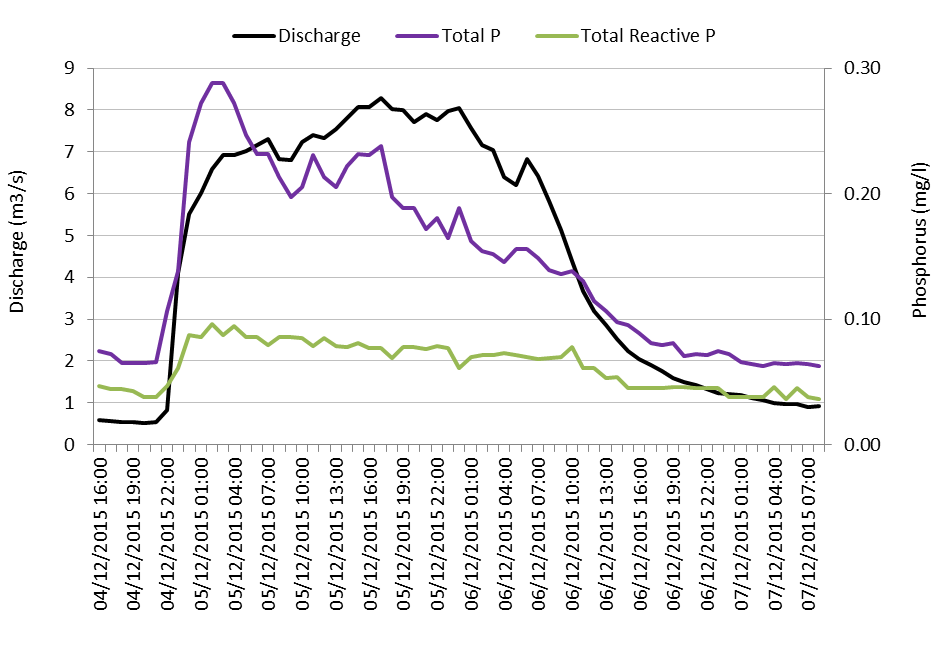
- Maximum and averaged concentrations of TP/TRP were lower than those recorded during some other storms (e,g, max. TP was 0.29 mg l-1 during Desmond compared to 0.84 mg l-1 during storm on 08 Nov 2015 or 1.0 mg l-1 on 22 Nov 2012)
- The lower concentrations were attributed to the antecedent conditions during November – saturated ground and numerous smaller storms in quick succession, which may have flushed out the most readily mobilised sediment and nutrients. Nevertheless the duration of the storm and sustained high discharge ensured that loads exported were high.
The build up:
For Desmond only:
| Newby Beck | Pow Beck | Thackthwaite Beck | |
| Rainfall start | 04 Dec 2015 20:00 | 04 Dec 2015 19:00 | 04 Dec 2015 19:00 |
| Rainfall end | 06 Dec 2015 08:00 | 06 Dec 2015 05:00 | 06 Dec 2015 08:00 |
| Rainfall duration | 36 hours | 34 hours | 37 hours |
| Rainfall total | 156 mm | 55.2 mm | 174 mm |
| Rainfall peak intensity | 6.2 mm/hr | 3.2 mm | 8.7 mm/hr |
| Discharge start | 04 Dec 2015 20:00 | 04 Dec 2015 19:00 | 04 Dec 2015 20:00 |
| Discharge end | 07 Dec 2015 08:00 | 07 Dec 2015 09:00 | 06 Dec 2015 20:00 |
| Discharge duration | 60 hours | 62 hours | 48 hours |
| Discharge total | 83 mm | 92 mm * | 180 mm |
| Discharge peak | 2.4 mm/hr | 2.9 mm/hr * | 7.7 mm/hr |


*Discharge rating at Pow is no longer valid due to stream bed change
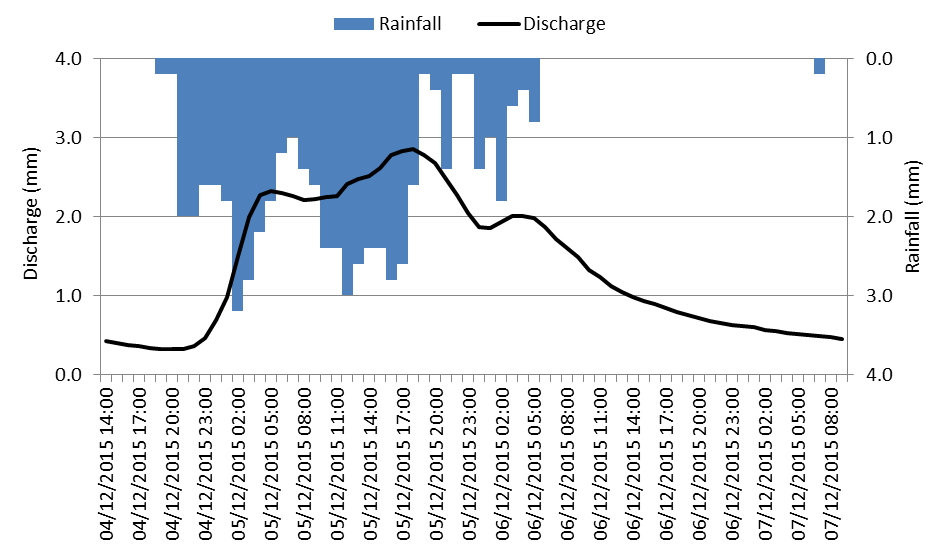
Newby Beck: Total rainfall: 156 mm
Pow Beck: Total rainfall: 55.2 mm
Thackthwaite Beck: Total rainfall: 174 mm
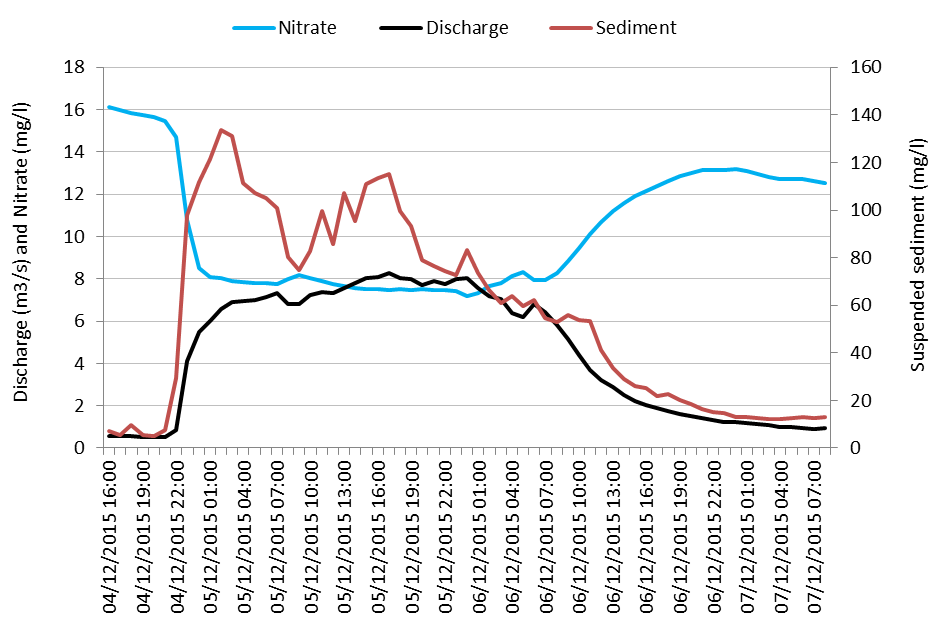
For nutrients, the only data available is from Newby Beck:
| Sediment (t) | Total P (kg) | Total Reactive P (kg) | Nitrate (t) | |
| Storm Desmond export | 84 | 194 | 78 | 8.9 |
| Annual export | 380 – 680 | 1670 – 2320 | 650 – 920 | 68 – 94 |
| % of annual | 12 – 22 | 8 – 12 | 8 – 12 | 9 – 13 |
| During Desmond: | mg/l | mg/l | mg/l | mg/l |
| Min Conc. | 5* | 0.062* | 0.037* | 7.2 |
| Max Conc. | 134 | 0.288 | 0.096 | 15.7* |
| Time averaged conc. | 61 | 0.151 | 0.065 | 9.9 |
| Flow weighted conc. | 81 | 0.186 | 0.074 | 8.4 |
*Minimum concentrations of SS, TP, TRP and maximum nitrate were recorded at the beginning of the event (i.e. they represent initial values before response started)
For comparison, concentrations during the event on 8 November 2015 are given below (storm duration 20h compared with 60h for Storm Desmond)
| During storm 8 Nov | mg/l | mg/l | mg/l | mg/l |
| Min Conc. | 8 | 0.105 | 0.051 | 15.2 |
| Max Conc. | 439 | 0.842 | 0.178 | 23.6 |
| Time averaged conc. | 89 | 0.305 | 0.108 | 19.2 |
| Flow weighted conc. | 144 | 0.433 | 0.133 | 17.7 |
| Total load | 30 tonnes | 78 kg | 24 kg | 3.2 tonnes |
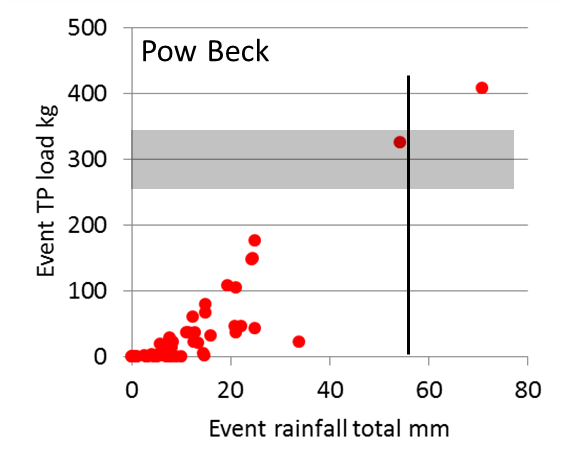
Using a linear event rainfall-event TP load relationship (as in Ockenden et al., 2016), we could predict the TP load at Pow for an event of 55.2 mm:
Predicted load (including the uncertainty in the event rainfall – event load relationship) is 250 – 350 kg TP.
For Newby Beck, the measured TP load of Storm Desmond was lower than the linear relationship (based on events in 2011/12) suggested:
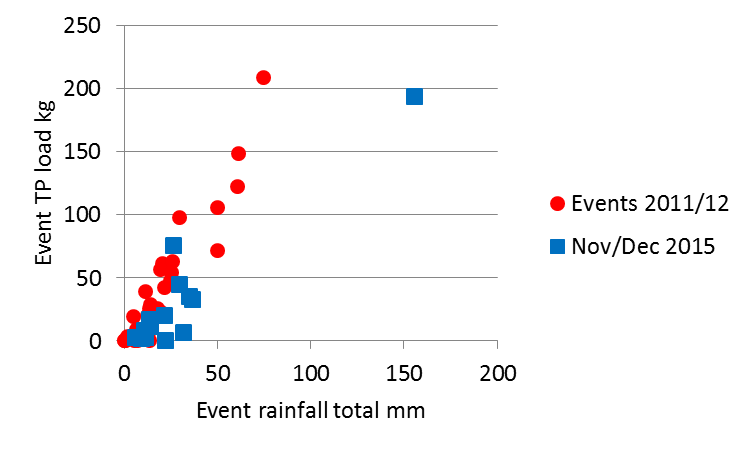
However, the events in November may have resulted in flushing of P in November. Note the event on 9th November which resulted in the highest concentration of TP, TRP and SS recorded in November or December. Concentrations recorded in Storm Desmond were not as high, even at the start of the event when the highest concentrations are usually recorded. However, due to the long duration of the event (discharge > 5 m3 s-1 for 34 hours), the total loads were still large.
Storm Desmond and Eden DTC3
Reference:
Ockenden, M.C., Deasy, C.E., Benskin, C.M.H., Beven, K.J., Burke, S., Collins, A.J., Evans, R., Falloon, P.D., Forber, K.J., Hiscock, K.M., Hollaway, M.J., Kahana, R., Macleod, C.J.A., Reaney, S.M., Snell, M.A., Villamizar, M.L., Wearing, C., Withers, P.J.A., Zhou, J.G. and Haygarth, P.M., 2016. Changing climate and nutrient transfers: Evidence from high temporal resolution concentration-flow dynamics in headwater catchments. Science of the Total Environment http:\\dx.doi.org/10.1016.j.scitotenv.2015.12.086.